Task Management

Andrey Shcherbina
Jul 23, 2025
The HR director of a fast-growing IT company faced a critical problem: employee turnover reached 45%, and closing vacancies stretched for months. The intuitive approach to personnel management stopped working. Through 8 months of systematic data work, he dramatically changed the situation: turnover decreased to 12%, hiring time was cut in half, and accuracy of personnel needs forecasting grew to 85%. The secret to success — transitioning from intuition to data.
The mymeet.ai team helps HR specialists apply analytical approaches to personnel management, starting with interview analysis automation and candidate assessment. Data-driven HR becomes a competitive advantage for companies in the battle for talent.
What is HR Analytics and Why is it Needed

HR analytics is the systematic collection, analysis, and interpretation of personnel data for making informed management decisions in human resources. This approach transforms HR from an administrative function into a strategic business partner.
Modern HR analytics goes far beyond simple employee counting or turnover calculation. It uses statistical methods, machine learning, and predictive modeling to identify patterns, forecast trends, and optimize HR processes.
The key difference from traditional HR reporting lies in decision-making focus rather than just fact recording. Analytics answers "why" and "what to do" questions, not just "what happened."
Impact on company business results manifests through reduced personnel costs, increased productivity, improved hiring quality, and faster HR decision-making.
HR Analytics Levels
HR analytics develops through four maturity levels, each solving specific tasks and requiring corresponding competencies.
Descriptive Analytics — "What Happened?"
Basic level includes calculating fundamental HR metrics and creating standard reporting. Answers questions: how many employees left, what's departmental turnover, how did staff numbers change.
Tools: Excel, simple dashboards, standard HRIS reports. Requires basic data skills and HR process understanding. Accessible to most companies.
Diagnostic Analytics — "Why Did This Happen?"
In-depth cause and relationship analysis through correlation analysis, employee segmentation, and comparative studies. Identifying factors affecting turnover, productivity, engagement.
Tools: statistical packages, advanced Excel functions, BI platforms. Requires understanding of statistical methods and result interpretation skills.
Predictive Analytics — "What Will Happen?"
Forecasting future trends using machine learning: predicting resignations, hiring needs, career development planning, project risk assessment.
Tools: Python, R, specialized ML platforms. Requires serious analytical competencies and understanding of machine learning algorithms.
Prescriptive Analytics — "What to Do?"
Highest maturity level that recommends specific actions based on optimization algorithms, simulations, and scenario modeling. Automatic personnel management recommendations.
Tools: advanced analytical platforms, proprietary algorithms. Available to few organizations with high technological maturity.
Key HR Analytics Indicators
Effective HR analytics builds on an interconnected metrics system covering all personnel management aspects from hiring to resignation.
Main HR Metric Groups:
Hiring and recruiting indicators — vacancy closing time, hiring cost, candidate quality
Personnel retention metrics — staff turnover, retention rate, employee loyalty index
Performance indicators — labor productivity, KPI achievement, training effectiveness
Engagement metrics — eNPS, engagement index, corporate program participation
Financial HR indicators — training ROI, labor cost, retention savings
Hiring and recruiting indicators help optimize talent attraction processes. Time-to-fill and Cost-per-hire are basic recruiting effectiveness metrics.
Personnel retention metrics are critically important for growing companies. High staff turnover leads to knowledge loss, productivity decline, and increased hiring costs.
Performance indicators link HR activities to business results. Revenue per employee is one of key personnel productivity indicators.
Detailed Key Metrics Breakdown
Proper calculation and interpretation of HR metrics requires understanding formulas, data collection methodology, and factors affecting indicators.
Metric | Calculation Formula | Benchmark | Example Calculation |
Staff Turnover | (Number of departures / Average headcount) × 100% | 10-15% annually | (25 / 200) × 100% = 12.5% |
Time-to-Fill | Average time from vacancy posting to employee start | 30-45 days | (20+35+15+40)/4 = 27.5 days |
Cost-per-Hire | Total recruiting costs / Number hired | $15,000-45,000 | $150,000 / 10 = $15,000 |
eNPS | % Promoters - % Detractors | > 50 excellent | 60% - 15% = 45 (good) |
Training ROI | (Training benefits - Costs) / Costs × 100% | > 300% | ($120,000 - $30,000) / $30,000 = 300% |
Absenteeism | (Absence days / Total work days) × 100% | < 3% | (150 / 5000) × 100% = 3% |
Staff turnover requires detailed analysis by resignation reasons, departments, and employee categories. Voluntary and involuntary turnover are analyzed separately.
Time-to-fill depends on position complexity, candidate requirements, and recruiting channel effectiveness. Mission-critical positions require separate tracking.
Cost-per-hire includes direct costs (recruiter salaries, job advertising) and indirect costs (manager time for interviews, newcomer adaptation).
HR Data Collection and Analysis Methods
HR analytics quality directly depends on source data completeness and reliability, making systematic approach to collection critically important.
HR Data Sources:
HRIS and personnel accounting systems — main structured employee database
Employee surveys and interviews — feedback and subjective engagement assessments
Performance evaluation systems — assessment results and 360-degree feedback
Corporate system data — email activity, corporate platform usage, CRM data
External sources — market salary data, industry benchmarks
HRIS (Human Resources Information System) contains structured data on demographics, career history, compensation, and benefits. This data quality determines analytics capabilities.
Employee surveys supplement quantitative data with qualitative insights about motivation, satisfaction, and future plans. Regular conduct is critically important for tracking dynamics.
Corporate system data opens new opportunities for behavior and productivity analysis. Email activity, corporate application usage, project participation are valuable engagement indicators.
HR Data Analysis Methods
Modern HR analytics uses a wide spectrum of statistical methods and machine learning techniques for extracting insights from data.
Correlation Analysis

Reveals relationships between various factors: salary and satisfaction, tenure and productivity, training and career growth. Correlation coefficient from -1 to +1 shows relationship strength and direction.
Practical application: determining factors affecting staff turnover, identifying engagement drivers, analyzing motivation program effectiveness. Important reminder: correlation doesn't mean causation.
Regression Modeling

Allows quantitative assessment of various factor influences on key metrics. Multiple regression helps build turnover, productivity, and candidate success prediction models.
Linear regression suits continuous variables (salary, tenure), logistic — for binary outcomes (stay/leave). R-squared shows what variation proportion the model explains.
Employee Cluster Analysis

Groups personnel by similar characteristics: demographics, behavior, preferences, productivity. Foundation for personalizing HR programs and targeted retention strategies.
K-means clustering is a popular algorithm for employee segmentation. Result: groups with different motivation, training, and career development needs.
Survival Analysis

Studies time until event occurrence — resignation, promotion, probation period completion. The method helps identify critical periods and risk factors, and build employee "survival" curves.
Kaplan-Meier curve shows employee "survival" probability in company depending on time. Cox regression considers various factors that influence resignation risk.
Practical HR Analytics Application
HR analytics is most effective when solving specific business tasks where data can substantially improve decision quality.
Key Use Cases:
Resignation prediction — identifying at-risk employees for preventive measures
Hiring process optimization — analyzing recruiting channel effectiveness and selection methods
Training planning — determining competency development needs based on data
Team formation — selecting optimal project group composition by competencies
Succession planning — identifying and developing high-potential talents
Resignation prediction is one of the most demanded cases. Machine learning models analyze historical data about departed employees and identify patterns: productivity decline, reduced corporate activity participation, communication changes.
Hiring optimization includes analyzing candidate conversion by funnel stages, various source effectiveness, interviewer prediction quality. Data helps redistribute recruiting budgets toward most effective channels.
Training planning becomes more accurate when analyzing correlations between competencies, training results, and business indicators. Skills gap analysis identifies critical competency shortages.
Creating HR Dashboards and Reporting
Effective HR data visualization is critically important for conveying insights to management and making operational decisions.
Metric Type | Recommended Visualization | Update Frequency | Audience |
Staff Turnover | Line chart + heat map by departments | Monthly | Top management, HR |
Hiring Time | Box plot + trend line | Weekly | HR, hiring managers |
Engagement | Gauge chart + distribution | Quarterly | All managers |
Performance | Scatter plot + regression line | Monthly | Line managers |
Compensation | Histogram + percentile bands | On request | HR, Finance |
Training ROI | Waterfall chart | After programs | HR, L&D |
Dashboards should be interactive with drill-down capability to a detailed level. Managers need to see aggregated indicators with ability to dive into problem areas.
Data update automation saves analyst time and ensures information relevance. Integration with data sources through APIs is preferable to manual updating.
Mobile dashboard versions allow managers to track key metrics in real-time and make operational decisions.
mymeet.ai for HR Analytics

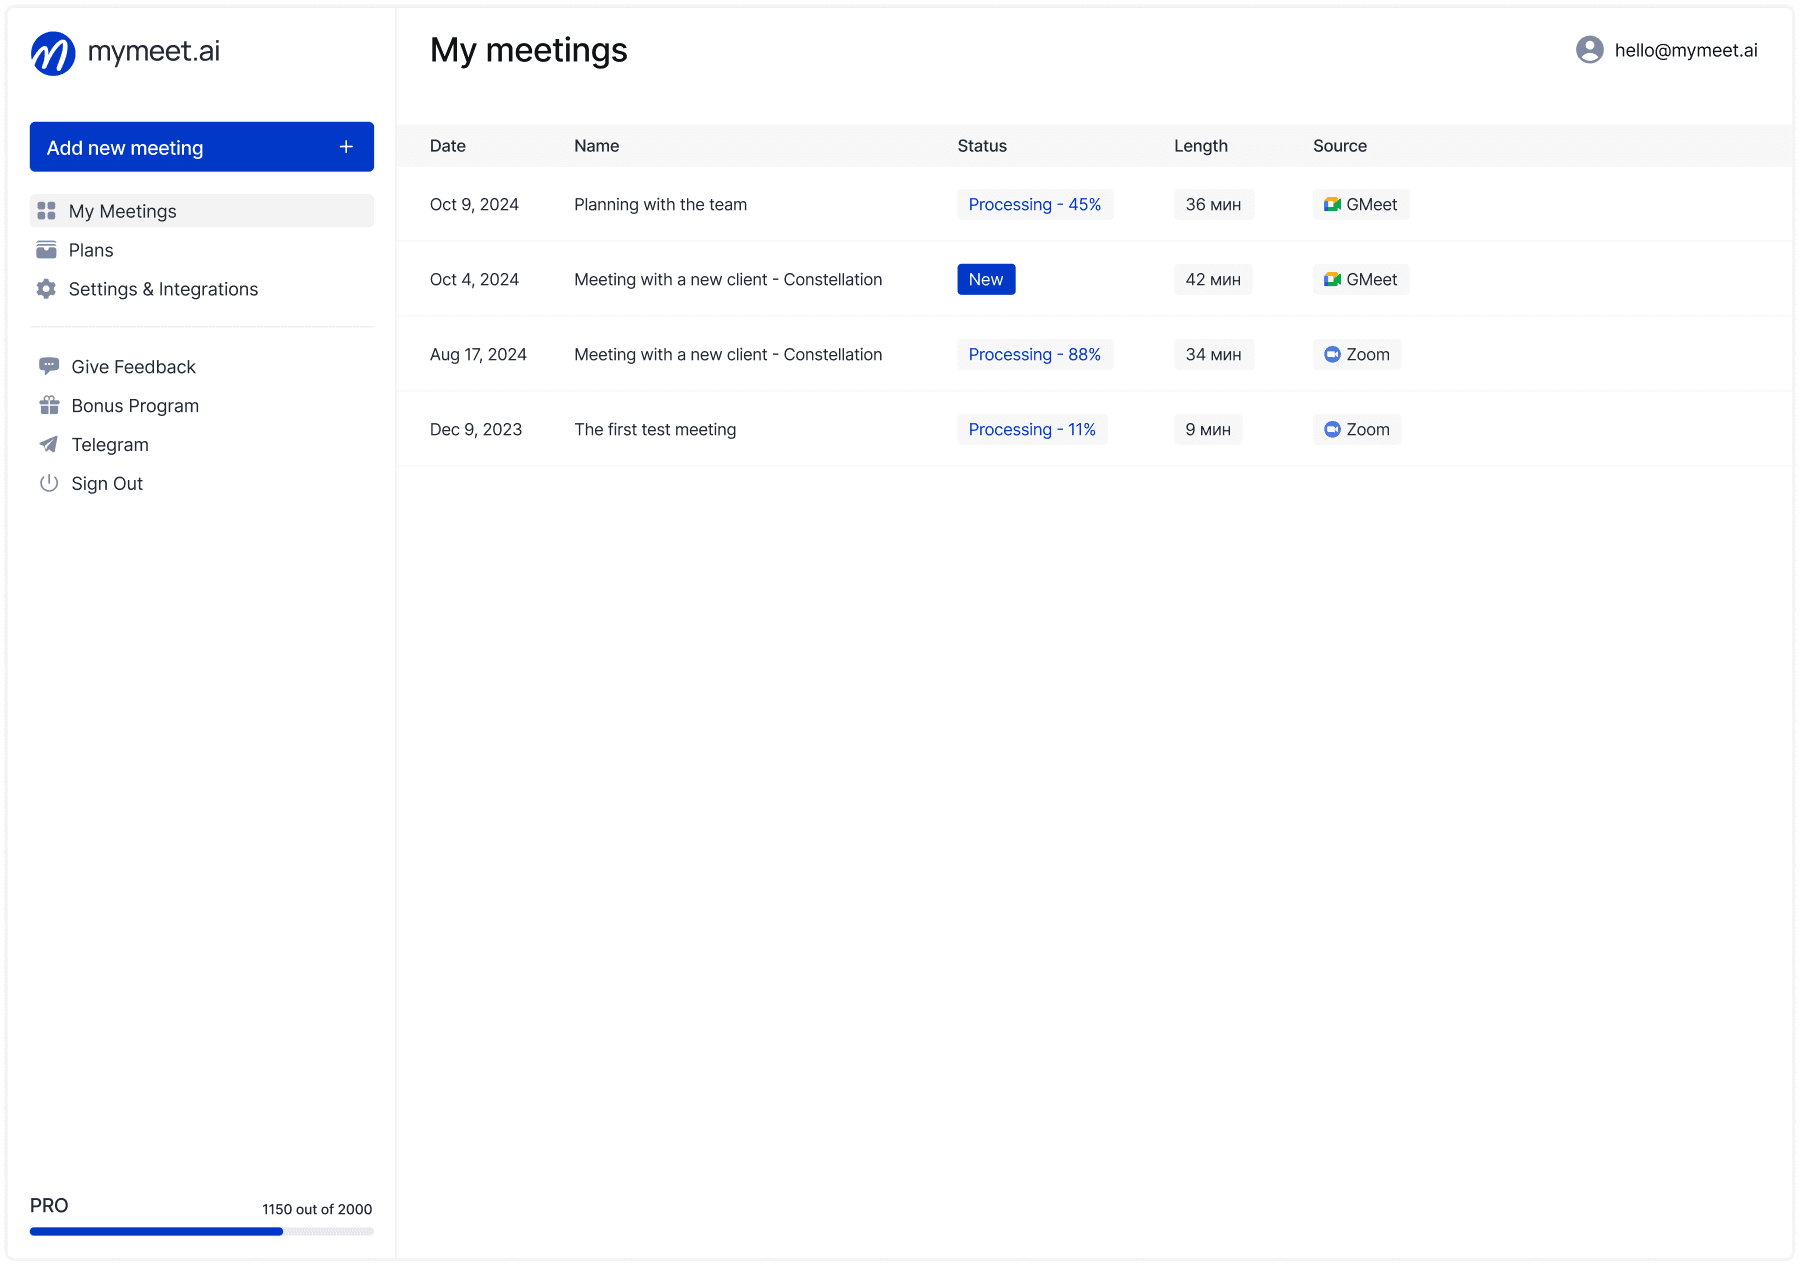
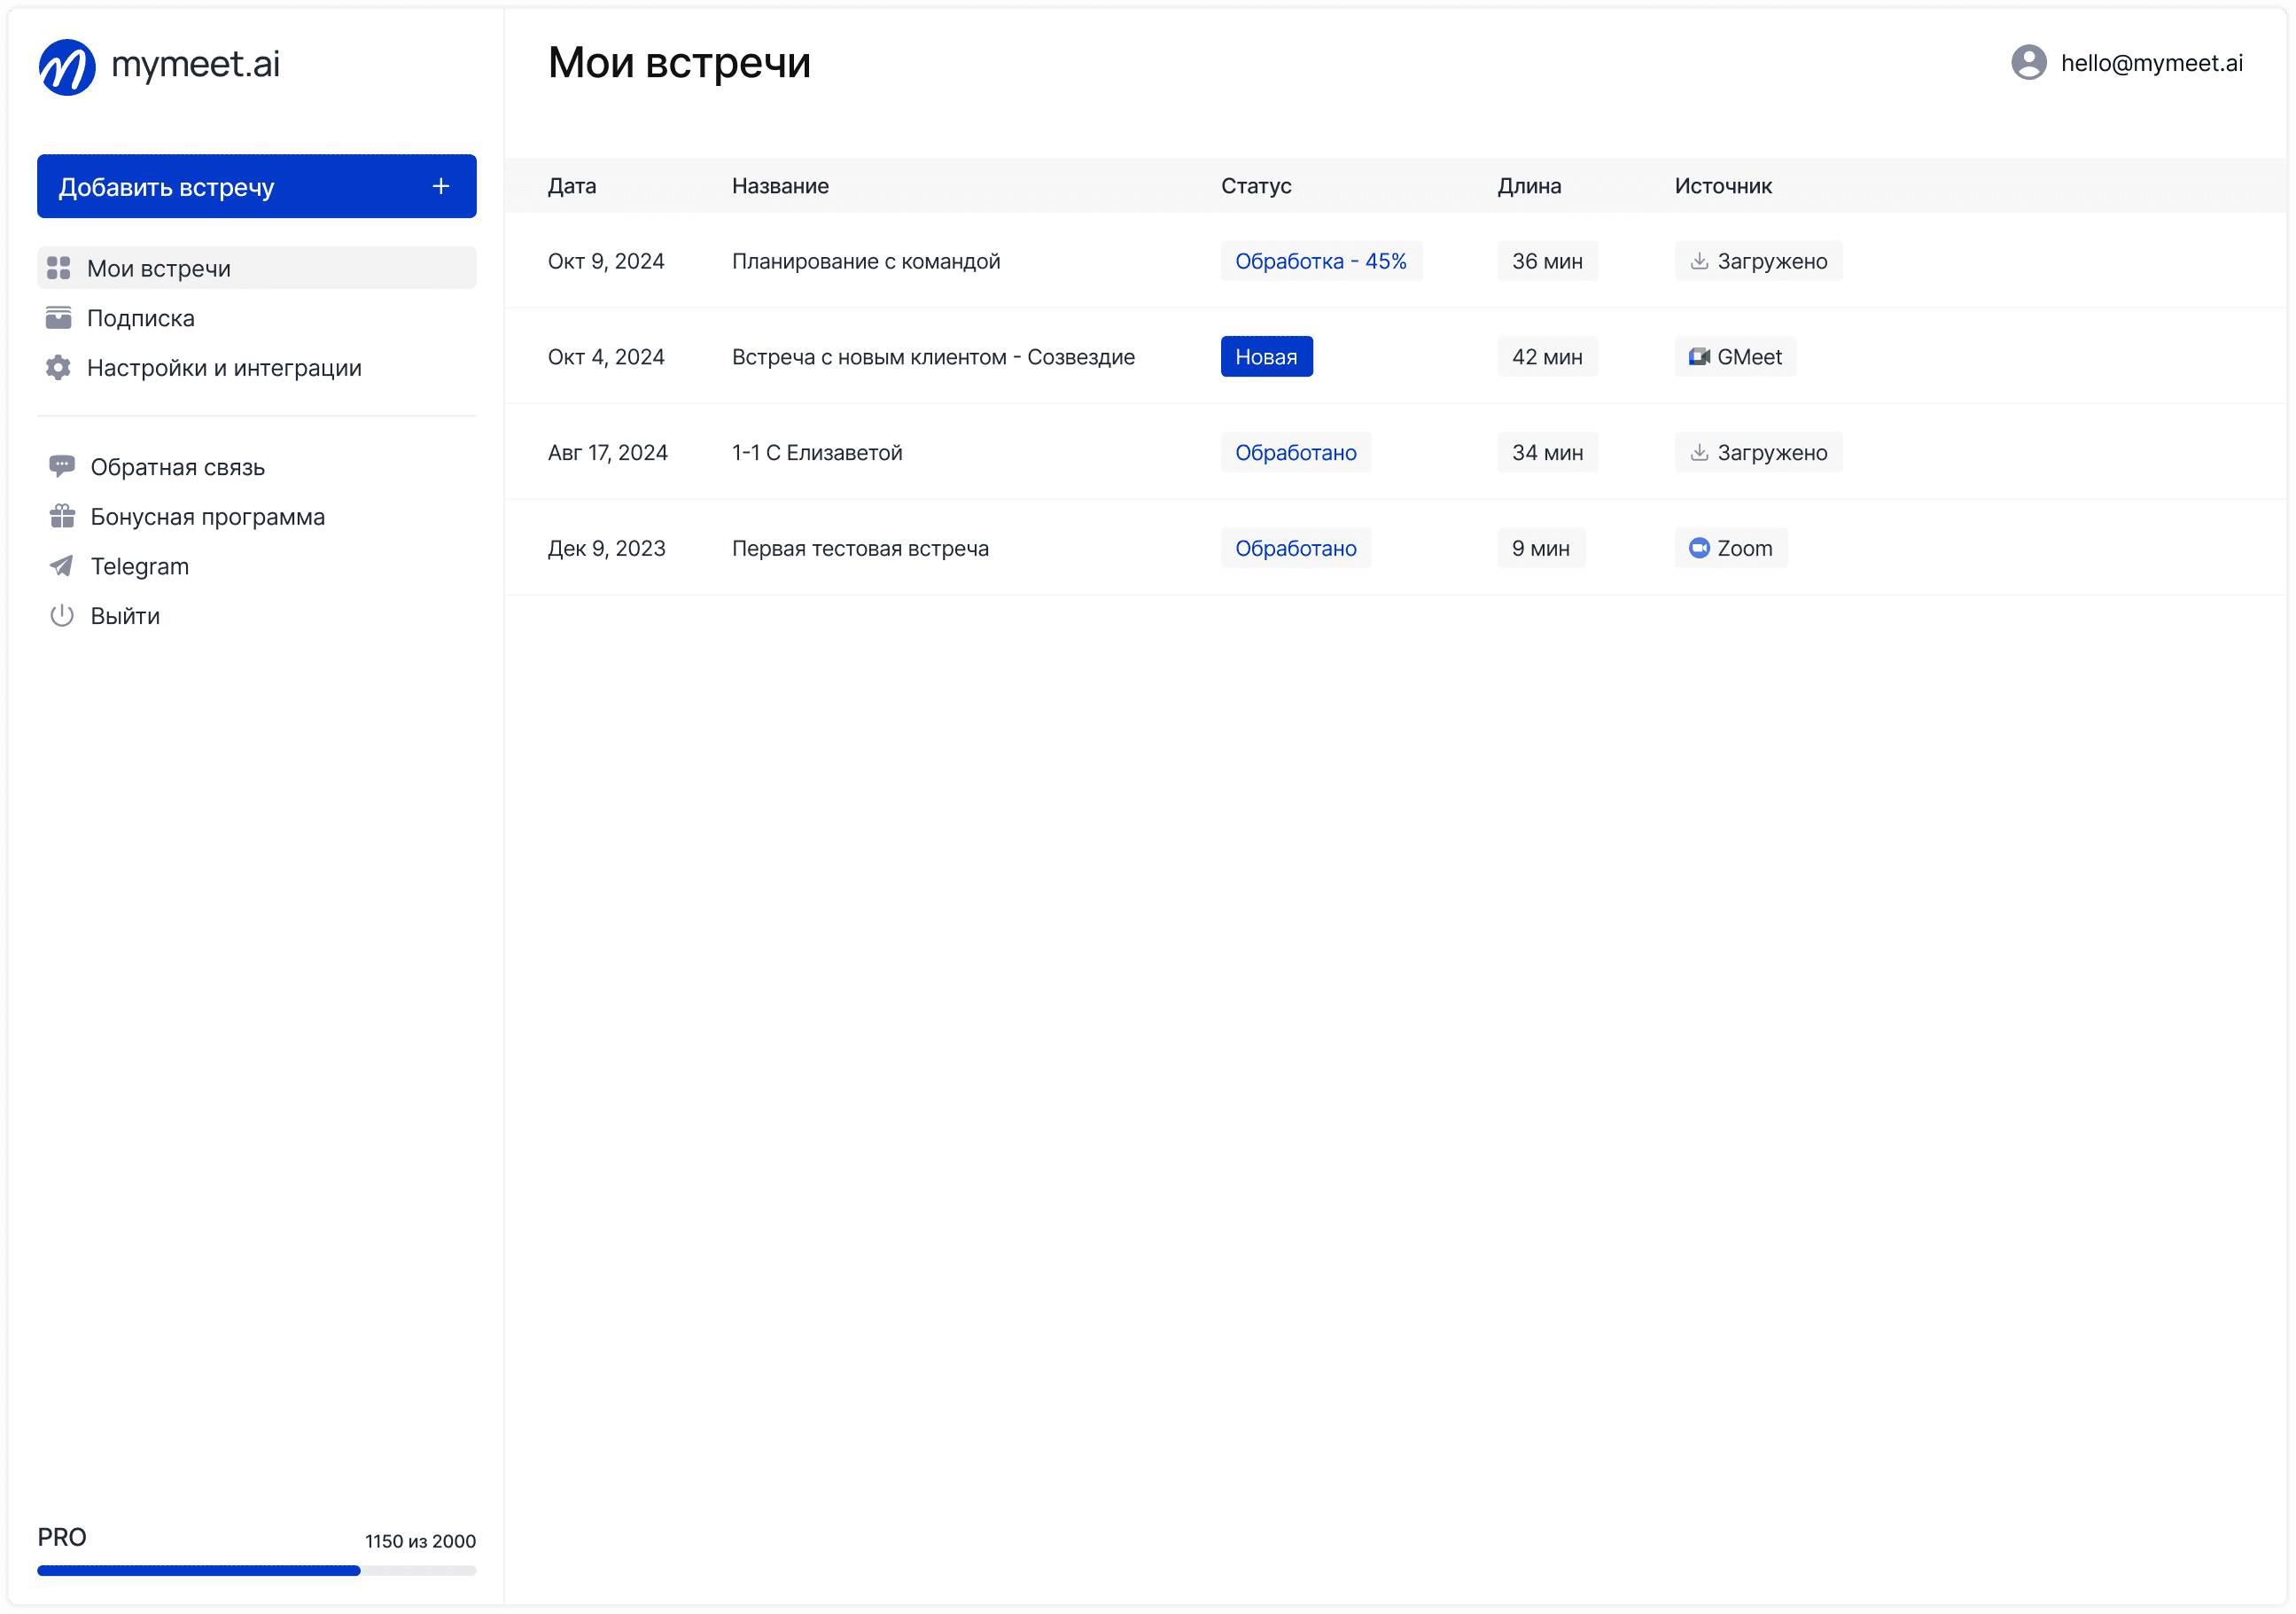
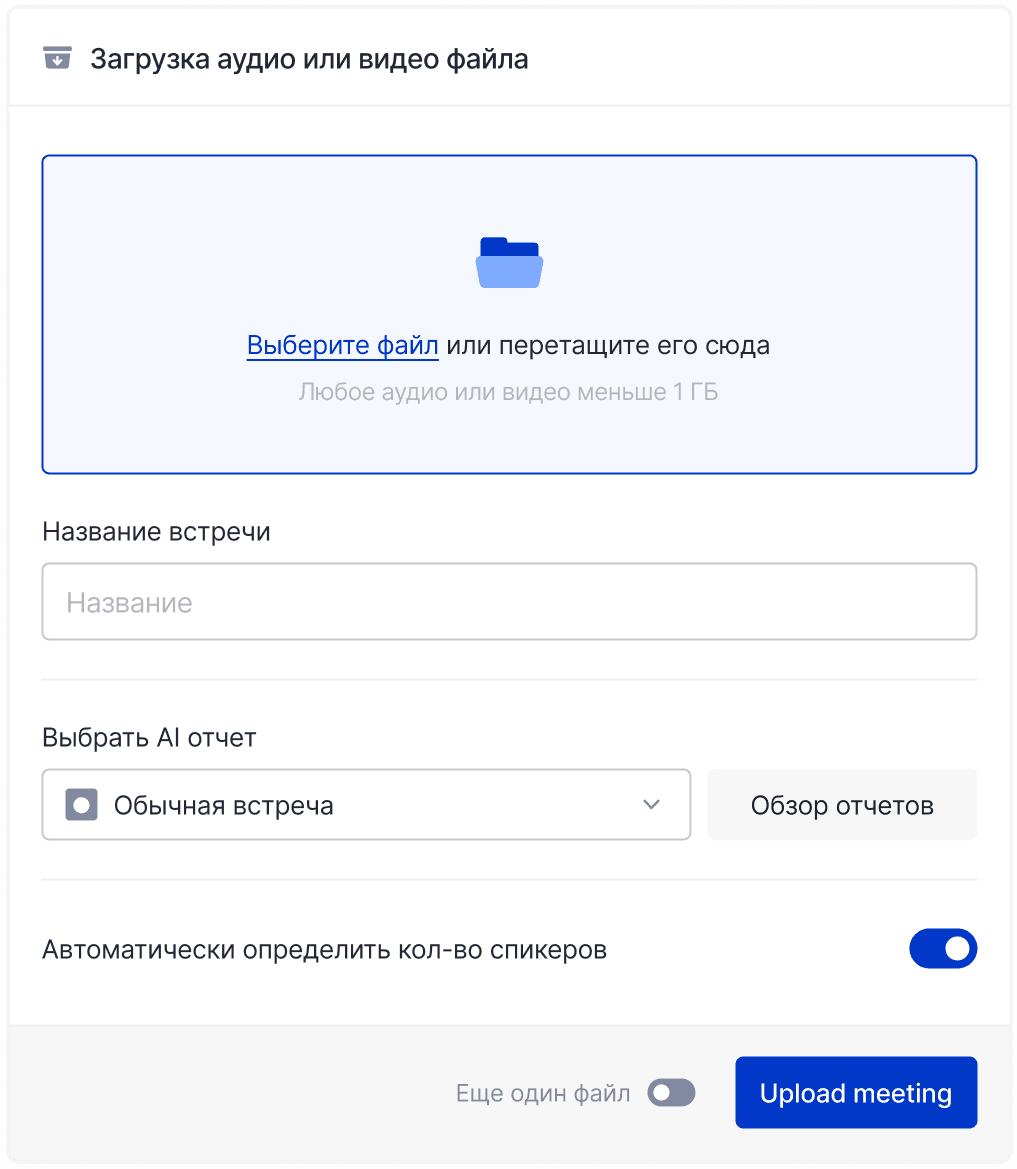
The mymeet.ai platform opens new opportunities for HR analytics through automatic interview analysis, employee meetings, and other HR communications using artificial intelligence.

Key mymeet.ai capabilities for HR:
✅ HR interview and candidate meeting effectiveness analysis
✅ Automatic key competency and skill extraction from interviews

✅ Feedback quality and employee communication analytics
✅ HR meeting topic monitoring and 1-on-1s with managers
✅ Structured interview result report creation
✅ HR system integration for automatic profile updates

✅ Personal data confidentiality requirement compliance
✅ API for integration with existing HR analytics platforms
The platform analyzes not only what candidates and employees say, but how they say it: voice tone, answer confidence, thinking structure. This data supplements traditional HR metrics with qualitative insights.
mymeet.ai Use Case in HR Processes
A Moscow IT company implemented mymeet.ai for analyzing interviews with technical position candidates. Previously, candidate evaluation was subjective and depended on interviewer experience.
The AI system automatically analyzes candidate responses, highlights technology mentions, assesses knowledge depth and thinking structure. An objective competency profile is created for each candidate.
Result: 40% increase in candidate success prediction accuracy, 50% reduction in hiring decision time, standardized evaluation process across different interviewers.
Train employees to work with the AI assistant. Submit an application via the form for a corporate webinar.

Building HR Analytics System
Successful HR analytics implementation requires a systematic approach with clear planning of stages, resources, and expected results.
HR Analytics Implementation Stages:
Current data audit — assessing personnel information quality, completeness, and availability
Key metric determination — selecting indicators aligned with strategic business goals
Tool selection — platforms for HR data collection, analysis, and visualization
Team training — developing HR specialist analytical competencies
Pilot projects — testing approaches on limited task sample
Scaling — implementing analytics system across entire organization
Data audit identifies information gaps, duplication, errors, and inconsistencies. Data quality is any analytics foundation. "Garbage in, garbage out" is a fundamental data principle.
Metric determination should stem from business goals, not technical capabilities. Start with 5-7 key indicators that actually influence decision-making.
Tool selection depends on team technical maturity, budget, and task complexity. Excel may suffice for initial level, specialized HR platforms for advanced level.
Common Implementation Mistakes
Understanding frequent mistakes helps avoid problems and accelerate value from HR analytics.
Focus on Data Collection Instead of Decision Making
Classic mistake — accumulating enormous data masses without understanding how they'll be used. It is important to immediately determine what specific decisions will be made based on each metric.
Correct approach: start with a business question, then determine necessary data. "What factors affect IT department turnover?" is more important than "let's collect all employee data."
Ignoring Source Data Quality
Inaccurate, incomplete, or outdated data leads to erroneous conclusions and lost trust in analytics. "Garbage in, garbage out" is a fundamental data principle.
Invest in data cleaning and standardization. Duplicate records, different date formats, missing values make analysis meaningless. Data quality is more important than quantity.
Overestimating Predictive Analytics Capabilities
Beginners often expect magical future predictions from machine learning algorithms. Reality: even best models give probabilistic estimates with certain errors.
Start with descriptive analytics, study historical data patterns. Gradually develop competencies and model complexity. Simple regression often works better than complex neural networks.
Lack of Line Manager Involvement
HR data should help all managers make better decisions, not just the HR department. Without line manager support, analytics remains an academic exercise.
Train managers in data interpretation, create simple dashboards, conduct regular metric reviews. Show how data helps solve their daily team management tasks.
Legal Aspects of HR Analytics
International legislation imposes specific requirements on personal data collection, storage, and use in HR analytics.
Legislative Requirements:
Compliance with data protection regulations when processing employee personal data
Obtaining employee consent for analytical data use
Restrictions on sensitive personal information collection and storage
Ensuring employee rights to access and correct their own data
Requirements for HR data protection and secure processing
Data protection regulations govern practically all HR analytics aspects. Processing consent must be specific for each data use purpose.
Special personal data categories (nationality, health, criminal records) require special protection measures and limited analytics use.
Cross-border data transfer may be restricted for companies. Using foreign cloud services for HR analytics might violate localization requirements.
HR Analytics Ethical Principles
Besides legal requirements, it's important to observe ethical principles when using employee data.
Algorithm and decision-making principle transparency helps maintain employee trust. People should understand how their data is used and what decisions are made based on it.
Non-discrimination and equal opportunities are ethical HR analytics foundations. Algorithms shouldn't reproduce or amplify existing prejudices and stereotypes.
Balance between company interests and employee privacy requires constant attention. Not everything technically measurable is ethical and advisable to track.
Right to explanation of algorithm-based decisions has become an important principle of modern HR practice.
Conclusion
HR analytics transforms personnel management from art into science based on data and objective insights. Companies mastering analytical approaches gain significant advantages in attracting, developing, and retaining talent.
Start with simple indicators and gradually develop analysis complexity. Focus on solving specific business tasks rather than tool technical capabilities.
Modern AI technologies open new horizons for HR analytics. Start using artificial intelligence capabilities today with mymeet.ai — 180 minutes of free testing will show how AI can improve your HR process effectiveness and decision quality.
FAQ about HR Analytics
What is HR analytics in simple terms?
HR analytics is using employee data to make better personnel management decisions. Instead of intuition, HR specialists analyze numbers: who and why leaves, which candidates work better, what affects employee motivation.
What main indicators are used in HR analytics?
Key metrics include staff turnover, vacancy closing time, hiring cost, employee engagement (eNPS), labor productivity, training ROI, absenteeism. The specific set depends on company goals and specifics.
How to calculate staff turnover?
Formula: (Number of departures per period / Average headcount) × 100%. For example, if 25 people left during the year with average headcount 200, turnover is 12.5%. The normal indicator is 10-15% annually.
What tools are needed to start HR analytics?
Start with Excel or Google Sheets for basic calculations. For automation, use Power BI, Tableau, or specialized HR platforms. Data quality is more important than tool complexity.
How to get employee consent for HR analytics?
Consent must be voluntary, informed, and specific. Explain what data is collected, how it's used, how it's protected. Employment contract consent doesn't cover analytical purposes — separate consent needed.
Can HR analytics be used for employee termination?
Analytics can identify performance problems but shouldn't be the sole termination basis. Use data to identify support and development needs, not for automatic sanctions.
How often should HR metrics be updated?
Frequency depends on metric: turnover — monthly, hiring time — weekly, engagement — quarterly. Critically important indicators may require daily monitoring.
What mistakes are most common when implementing HR analytics?
Main mistakes: focusing on data collection instead of decision-making, ignoring source data quality, trying to immediately build complex models, lack of metric connection to business goals, underestimating team training importance.
Do HR specialists need to study programming for analytics?
Basic Excel skills and statistics understanding are more important than programming. For advanced analytics, SQL knowledge for database work is useful. Python and R are only needed for complex modeling.
How to protect personal data in HR analytics?
Comply with data protection regulations: obtain consent, limit data access, use encryption, regularly delete irrelevant information. Data anonymization reduces risks when working with analytics.
Andrey Shcherbina
Jul 23, 2025


