Product Updates

Andrey Shcherbina
·
Updated on

On a team of twelve, meetings happen everywhere at once. Someone is on a client call in Zoom, someone runs interviews in Telemost, someone uploads recordings of in-person sessions. It all lands in a single workspace — but until now there was no overall picture of it.
Ask the person running that team how many meetings went through the service last month and the answer is "a lot". How many of those were uploaded files rather than online calls? Which report does the team use more than the rest? How many people actually work in the service? Those answers had to be assembled by hand: ask around, scroll the meetings list, paste it into a spreadsheet.
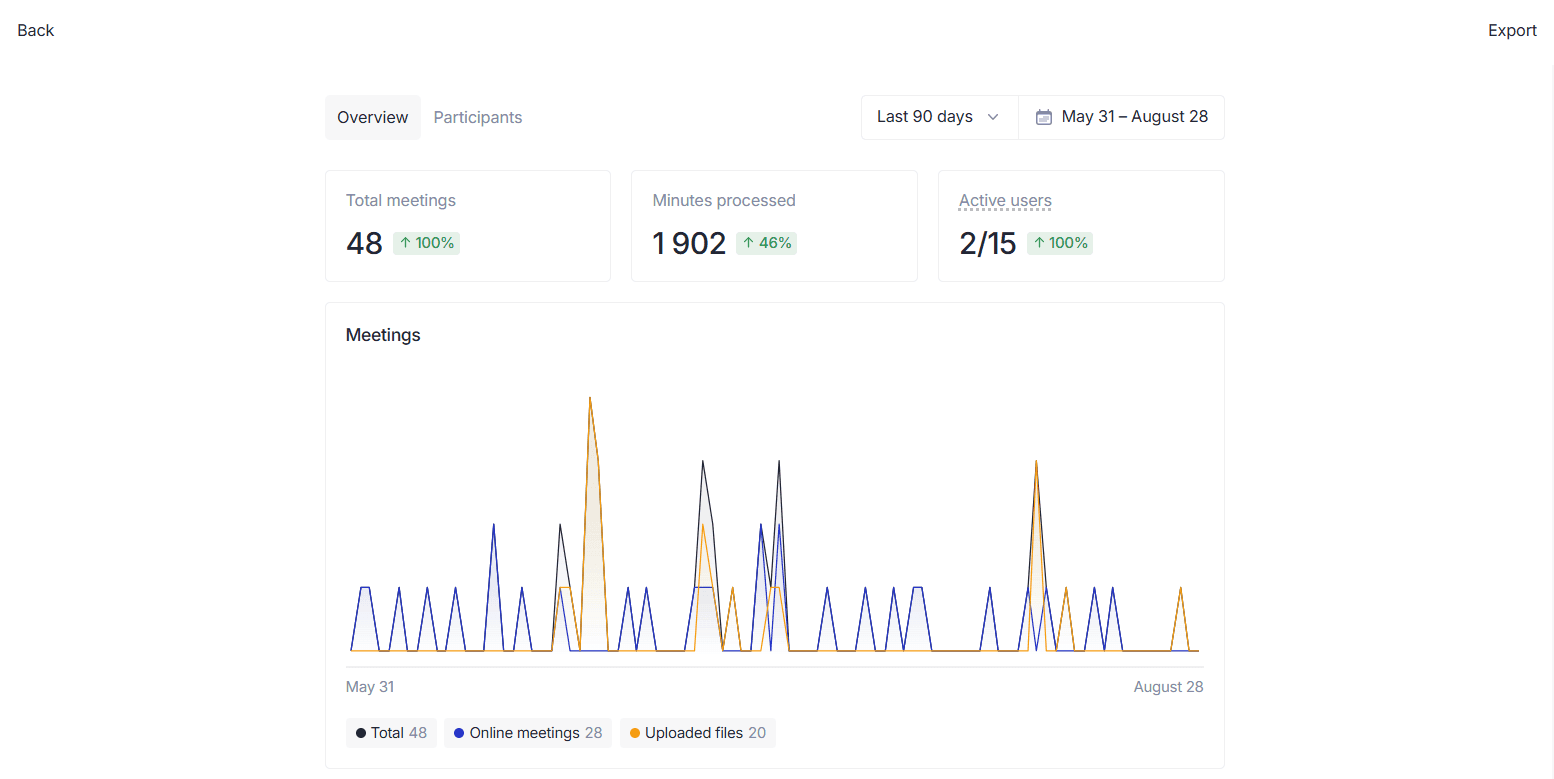
So we added workspace analytics. You can now see how your team works with meetings: how many took place, how many minutes were processed, and how many active users there are in the workspace.
Below: what it shows, how teams use it, how to open it, and how deep the data goes.
What it shows
The overall picture for a period
How many meetings and minutes went through the team, and how many people work in the service. Three numbers that give you the scale — not "we use it quite a bit", but a specific volume for a specific month or quarter.
Analytics per team member
Meetings, uploaded recordings, and minutes for each person. This is where you see how the work is distributed: who carries the main flow of calls, who works mostly with uploads, where the minutes are concentrated.
How the team adds recordings
Online meetings in Telemost, Google Meet, and Zoom — or uploaded files. It is a picture of where the team actually meets. If a sizeable share of the volume arrives as uploads, there are plenty of in-person sessions and calls that never touch an online platform.
Which AI Reports get used most
The split by report type shows which processes have already moved into the service. If the entire volume runs through a single template while other tasks get no reports at all, that stands out immediately.
How teams use it
Sales. Look at call volume for the month and how it spreads across managers and platforms. The report split shows whether the team reviews calls against one shared template or everyone improvises.
HR and recruiting. Add up interview volume for the period and break it down by recruiter. It also shows where interviews happen: online, or as uploaded recordings of in-person sessions.
Research. Count the number and total length of interviews in a fieldwork wave, then drop the export into the same field log as the rest of the respondent data.
Product teams. See how many discovery interviews and internal syncs happened in a sprint or a quarter, and which reports the team runs on them. If there is a dedicated discovery template, you can tell whether it actually gets applied.
Consulting and education. Pull the volume of delivered sessions for a client or leadership report. The HTML page can be attached as is: it opens in a browser and gives no access to the meetings themselves.
How to open it
"Usage analytics" sits in workspace settings and in the workspace dropdown menu. It is available to workspace owners and managers on the Business plan.
The section splits in two: the overall picture for the team, and analytics per team member. It opens on the last 30 days by default.
On other plans the section is still visible, but it opens as a preview — a summary of what is inside and a way to upgrade.
How deep the data goes
In time. Any period from a single day to the entire history of the team. There are ready options for 30, 90, and 120 days, and if you need an exact stretch — May, or the week a pilot launched — you can set it on the calendar. A single day breaks down by hour; longer periods break down by day.
By person. Down to the individual: meetings, uploads, and minutes for each.
Rows are tied to a person's email rather than to a paid seat. If someone leaves the team or a seat gets reassigned, the history does not collapse — the numbers from whoever worked there before stay in place.
In freshness. The numbers refresh after every new meeting; nothing has to be recalculated by hand.
Taking the numbers with you
An HTML page — the same statistics for the selected period, as a file. It opens in a browser and needs no access to the workspace, which makes it easy to attach to a report or send to a manager who has no account.
A table — for a closer look. One row per meeting: date, author, duration, platform, and the report type applied. Any summary can be rebuilt from those rows — by quarter, by department, by whatever you need. The file can go to internal analytics or to an AI agent.
Either way, only the facts about meetings are exported. Meeting titles and content are not.
Frequently asked questions
Who has access to workspace analytics in mymeet.ai? The section is available to workspace owners and managers on the Business plan. On other plans it is still visible, but opens as a preview of what is inside.
Where do I find workspace analytics? The section is called Usage analytics and sits in workspace settings. Owners and managers can also open it straight from the workspace dropdown menu.
What time period can workspace analytics cover? Anything from a single day to the entire history of the team. There are ready options for 30, 90, and 120 days, and any custom range can be set on the calendar. The default view is the last 30 days.
What is included in the analytics export? Statistics can be downloaded as an HTML page or as a table with one row per meeting: date, author, duration, platform, and the report type applied. Meeting titles and content are not exported.
How often do the numbers update? After every new meeting in the workspace. Nothing has to be recalculated by hand.
Getting started
Open workspace settings or the workspace dropdown menu.
Go to "Usage analytics" and pick a period.
Read the overall picture, then switch to analytics per team member.
Need the numbers elsewhere? Download them as an HTML page or a table.
Workspace analytics is available to workspace owners and managers on the Business plan. If you are rolling mymeet.ai out to a team or a company, fill out the form and our manager will walk you through the details.
Andrey Shcherbina